折线图
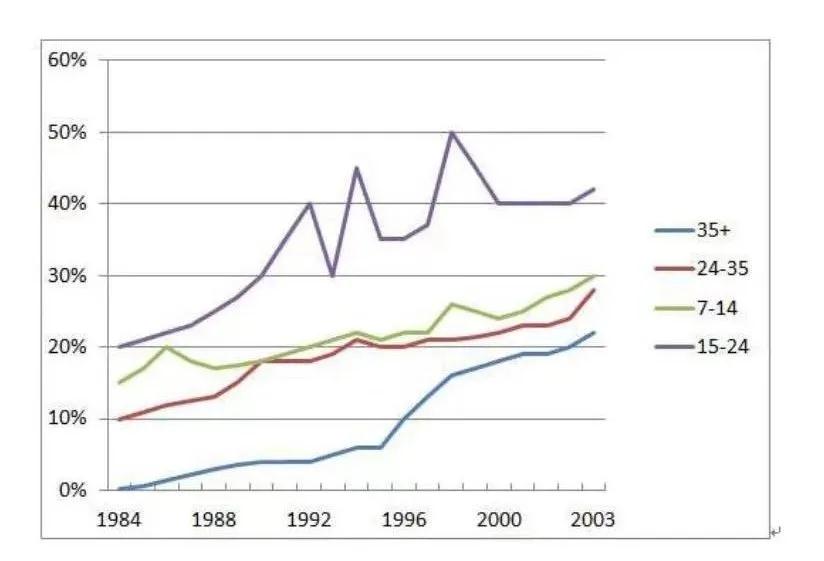
The chart shows the percentage of people of different age groups who went to the cinema once a month or more in the UK between 1984 and 2003.
Summarize the information by selecting and reporting the main features, and make comparisons where relevant.
» You should write at least 150 words.
题目大意:
1984~2003年,英国不同年龄段去电影院的至少一次的人数比例
范文示例:
开始段 - 改写题目:
The line chart illustrates the proportion of people of 4 age groups, who went to the cinema more than once every month in the UK. Generally, the total number of all age groups almost tripled throughout 20 years.
主体段-1:人数比例很多和很少的年龄段
The young people, aged 15-24, was the dominant one; on the other hand, the oldest group, aged above 35, was the least, with both of them undergoing overall increases. More specifically, starting from 20% in 1984, the rise of the former was particularly remarkable in the initial 7 years, during which time it almost doubled, and then despite some fluctuations, it eventually fell back to 40% in 2003. The latter, however, experienced a slight increase, from 0%-5%, and then there was a sharp climb, reaching just above 20% finally.
主体段-2:中间人数比例的年龄段
The rate of those who are aged 24-35 and that of children aged 7-14 were quite similar, with the middle age group slightly more than the youngest. From 15% and 10% respectively in 1984, both of them climbed drastically, with 30% and 28% in 2003. It is particularly noticeable that they were equal in 1990.
结尾段:
To summarize, overall increases can be noticed in all four age groups, and in 2003 the proportion of those aged 15-24 was the only one exceeding 40%, with the remaining three being similar, ranging from 10%-20%.