开始段 - 改写题目:
The line graphs compare the number of train passengers and the percentage of trains running on time between 1995 and 2004.
概述段:
人数一直上升,准点率多数时间波动,结果一年暴跌
In general, it is clear that the number of railway travelers increased over the 9 years shown on the graph, while the majority of trains were punctual for in years except 2003.
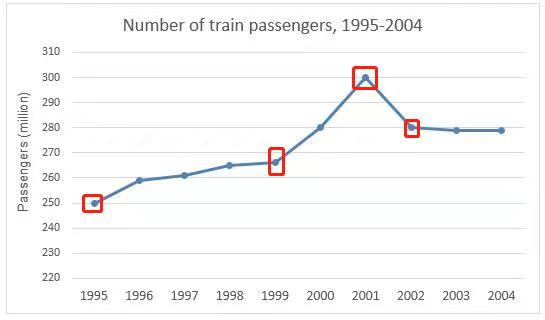
细节段-1:人数 – 核心数据
Looking at the information of passengers in detail, people travelling by railways stood at 250 million in 1995, and the figure rose slightly to approximately 265 million in 1999. The following 2 years saw a dramatic growth to the highest point on the graph, with the figure peaking at 300 million passengers. By contrast, a remarkable decline was seen in the year 2001, to about 280 million travelers, and the number remained stable until 2004.
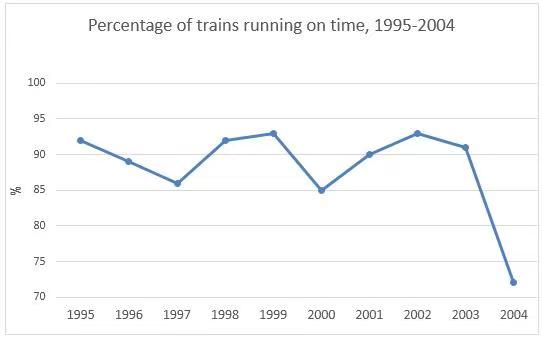
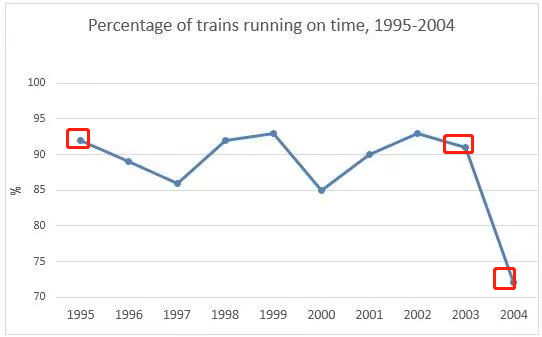
细节段-2:准点率 – 核心数据
As for the statistics of trains running on time, the punctuality rate fluctuated between 95% and 85% over the majority of the whole period; however, it is noticeable that the last year witnessed a significant drop to about 70%.